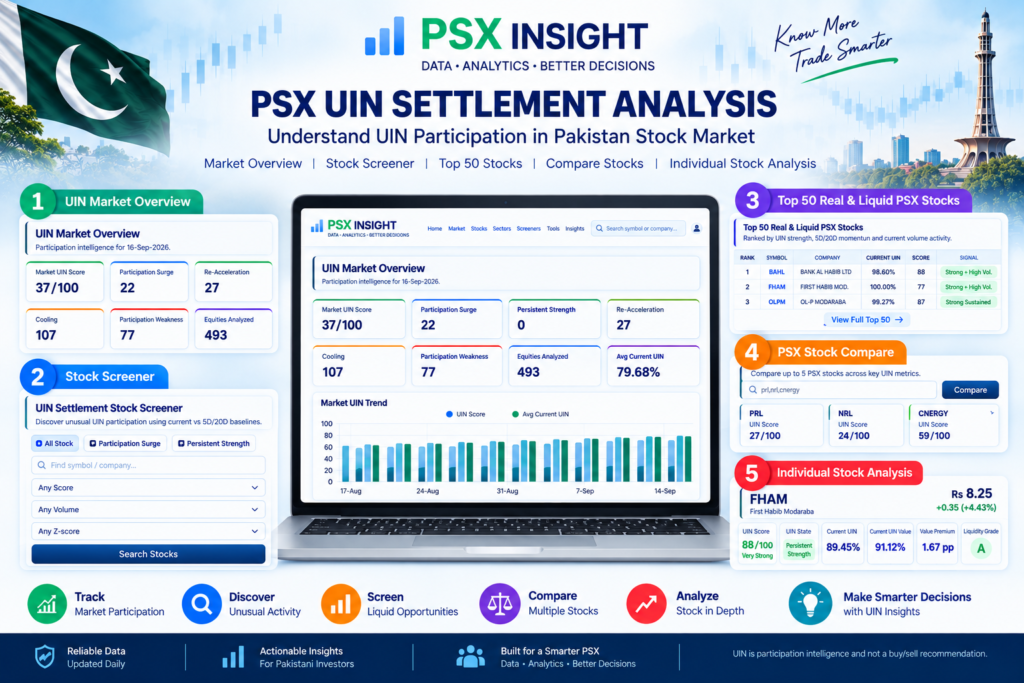
Price, volume and technical indicators explain important parts of market behaviour, but they do not provide the complete picture. PSX UIN Settlement Analysis adds another useful layer by showing how settlement participation is behaving and how current participation compares with a stock’s own history.
PSX Insight organizes this information into a practical research process:
UIN Market Overview → Screen → Compare → Validate → Decide
What Is UIN Settlement Data?
UIN stands for Unique Identification Number. NCCPL explains that UIN provides a centralized mechanism for registering investors in the National Clearing and Settlement System (NCSS), helping maintain a traceable link for stock-market trades and transactions. For official clearing, settlement and UIN information, visit the National Clearing Company of Pakistan Limited (NCCPL).
NCCPL Data + PSX Insight Analytics
The underlying UIN Settlement data is sourced from the National Clearing Company of Pakistan Limited (NCCPL). NCCPL publishes symbol-level Trade Volume, Trade Value, UIN Settlement Volume, UIN Settlement Value, UIN Percentage Volume and UIN Percentage Value.
PSX Insight adds its own analytical layer to this source data, including UIN Score, UIN State, 5D/20D comparisons, Z-Score, 60D Percentile, Participation Streak and liquidity analysis. These are PSX Insight analytics and should not be interpreted as official NCCPL ratings or recommendations.
Why UIN Participation Matters
A high UIN percentage by itself is not enough. A stock regularly recording 85% participation is different from one suddenly rising from a 50% historical level to 85%.
PSX Insight therefore examines participation across 1D, 5D and 20D, together with Δ5D, Δ20D, Z-Score, 60D Percentile, Participation Streak and Liquidity. These measurements help identify whether participation is unusual, persistent, strengthening or cooling relative to the stock’s own history.
Importantly, high UIN does not automatically mean buying, accumulation, institutional buying or a BUY signal. It describes participation behaviour and should be validated with other evidence.
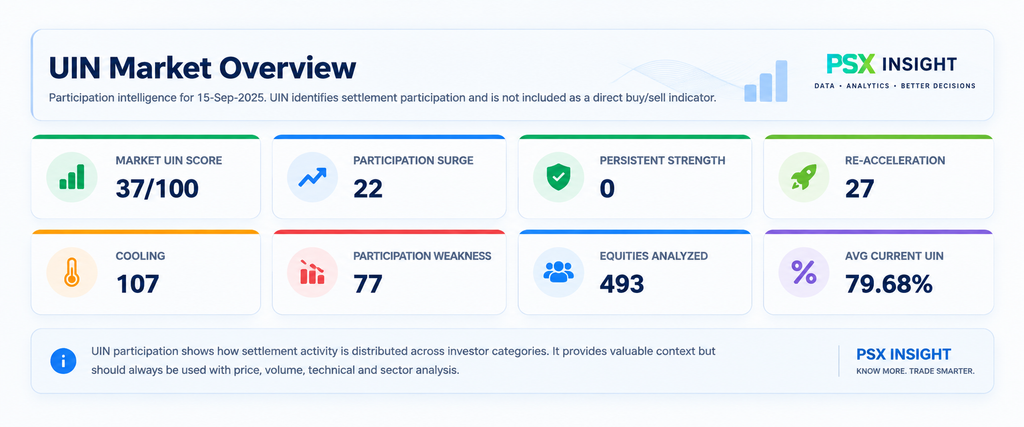
UIN Market Overview — Start Here
The UIN Market Overview on the PSX Insight Home page provides a quick picture of market-wide participation through Market UIN Score, Participation Surge, Persistent Strength, Re-Acceleration, Cooling, Participation Weakness, Equities Analyzed and Avg Current UIN.
Below it, Top UIN Participation Intelligence highlights noteworthy stocks using UIN Score, State, 1D/5D/20D participation, Δ5D/Δ20D, Z-Score, percentile, streak and liquidity.
The UIN Score ranges from 0–100 and summarizes the strength and quality of participation characteristics. A higher score is not a probability of future price appreciation and should not be treated as an automatic trade signal.
Find Stocks with the UIN Settlement Stock Screener
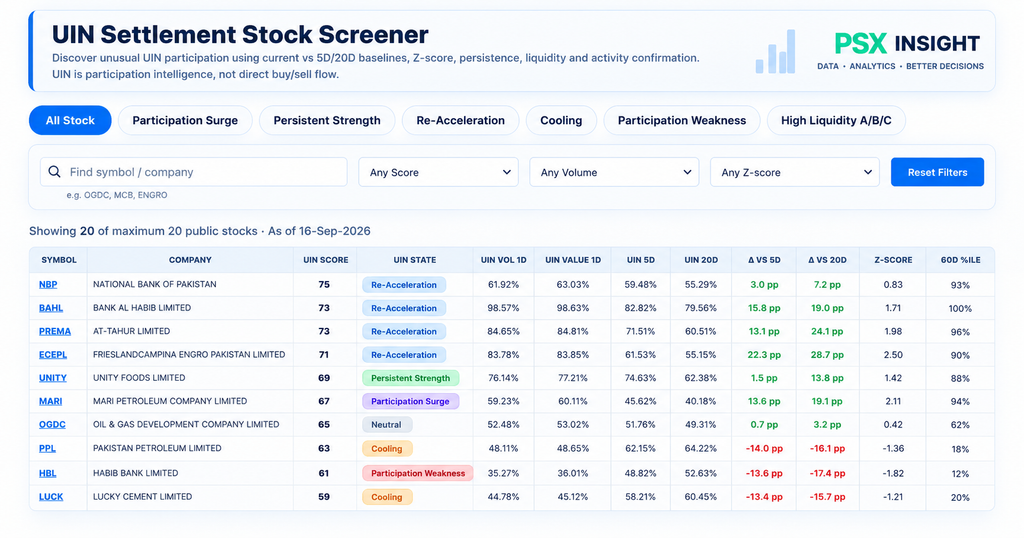
The UIN Settlement Stock Screener turns the wider PSX equity universe into a manageable research shortlist.
Users can screen through All Stock, Participation Surge, Persistent Strength, Re-Acceleration, Cooling, Participation Weakness and High Liquidity A/B/C, then refine results using Score, Volume, Z-Score and Symbol/Company search.
The initial table displays up to 20 results for readability, but exact-symbol search works across the broader eligible equity universe. Therefore, if a stock is outside the displayed Top 20, selecting its exact symbol can display that stock individually.
The result should be treated as a research shortlist—not a BUY list.
Compare Candidates with PSX UIN Stock Compare
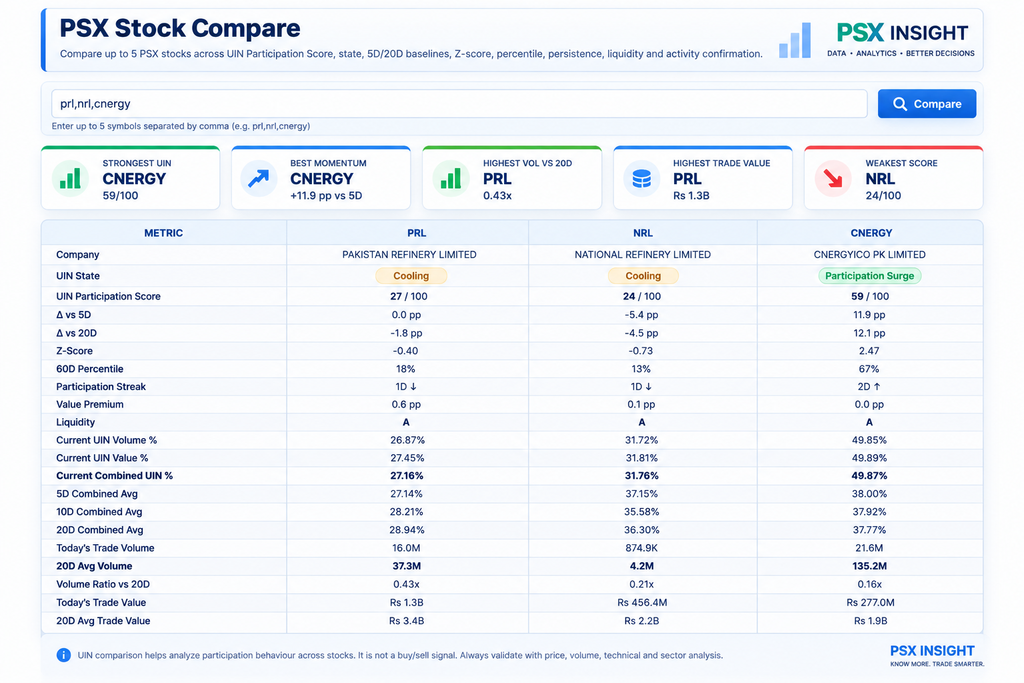
After creating a shortlist, PSX Stock Compare helps evaluate candidates side by side using UIN Score, State, Δ5D, Δ20D, Z-Score, percentile, Participation Streak, liquidity, UIN Volume/Value, volume ratio and traded value.
PSX Insight also shows Value Premium = UIN Value % − UIN Volume %. A positive Value Premium describes the relationship between value and volume participation; it should not automatically be interpreted as net buying.
Go Further: Top 50 Real & Liquid PSX Stocks
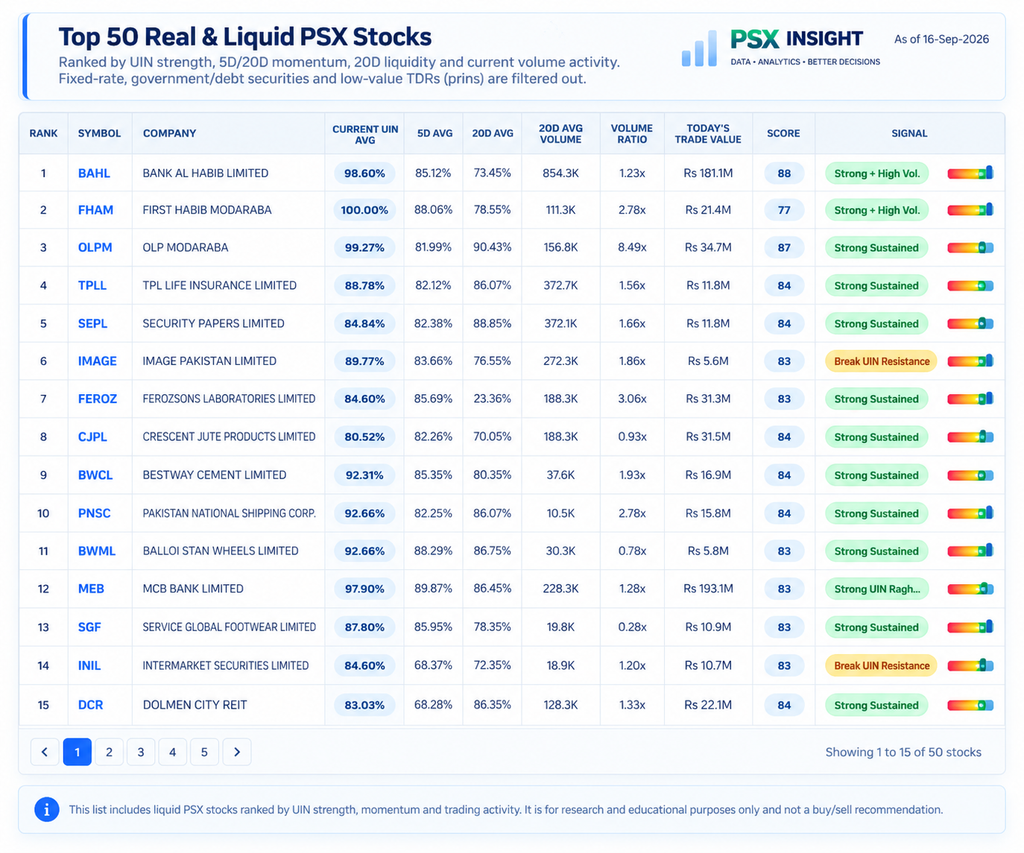
For investors who want a faster starting point, Top 50 Real & Liquid PSX Stocks narrows the market to a practical research universe using UIN strength, 5D/20D momentum, liquidity and current trading activity.
Instead of ranking stocks only by a high UIN percentage, the table combines Current UIN, 5D Average, 20D Average, 20D Average Volume, Volume Ratio, Today’s Trade Value, Score and Signal. This helps users identify liquid stocks showing noteworthy participation characteristics before moving to deeper analysis.
How to use it: Start with the higher-ranked liquid stocks, check whether participation is strengthening relative to 5D/20D history, and then open the stock for detailed analysis. The ranking is a research tool, not a buy recommendation.
Search Any Stock for Detailed UIN Analysis
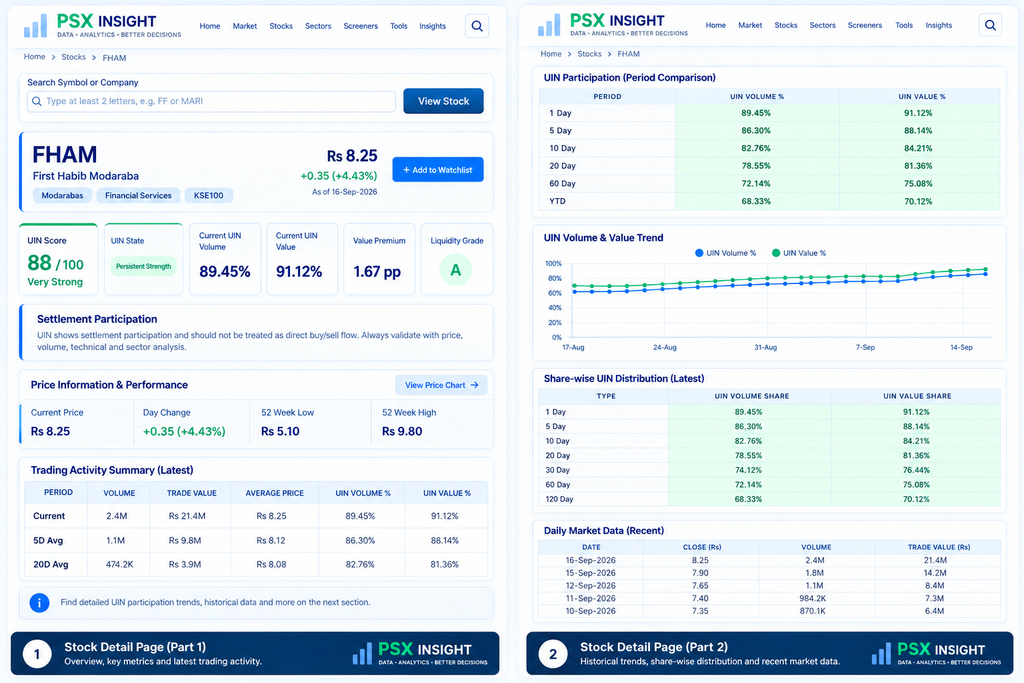
Already have a stock in mind? Use Search Symbol or Company to open its individual analysis page.
The stock page brings together the UIN Stock Score, UIN State, Current UIN Volume, Current UIN Value, Value Premium, Liquidity Grade, trading activity and historical UIN participation. Period comparisons and trend charts help show whether participation is strengthening, persistent or cooling.
This is especially useful after finding a stock through the UIN Settlement Stock Screener, Top 50 list or PSX Stock Compare. Use the detailed page to investigate the stock’s participation history, then validate it with price, volume, technical and sector analysis.
Best Way to Use PSX UIN Settlement Analysis
Use UIN as part of a broader research process:
Market Overview → Screener → Top 50 → Compare → Individual Stock Analysis → Validate → Decide
Start by understanding market participation, screen for interesting candidates, compare the strongest candidates, and then validate them using price trend, volume, technical indicators, Relative Strength vs KSE100 and sector strength.
UIN Settlement analysis is designed to identify and compare participation behaviour—not to predict price direction. Use it as one layer of evidence alongside price trend, volume, technical indicators, relative strength, sector analysis and appropriate risk management.
Disclaimer: PSX Insight provides settlement analytics and market research tools for informational and educational purposes only. Nothing on PSX Insight should be considered investment advice or a recommendation to buy, sell or hold any security.