Understand Where Money Is Moving in PSX
Stock prices tell you what the market is doing. Investor-flow data helps you understand who is buying, who is selling and where that money is moving.
The PSX Insight Investor Flow dashboard organizes Pakistan Stock Exchange investor data into an easy research process. It combines FIPI, LIPI, investor categories, sector flows, accumulation/distribution and historical flow trends in one place.
A practical way to use it is:
Market → Sector → Investor Category → Stock Opportunity → Technical Confirmation
Investor flow should not be treated as a standalone buy or sell signal. Instead, use it as an additional layer of evidence alongside price, volume, sector strength and technical analysis.

What Is PSX Investor Flow?
Investor flow measures buying and selling activity among different participants in the Pakistan Stock Exchange.
In simple terms:
Net Flow = Buying Value − Selling Value
Positive net flow means buying exceeded selling for the selected category and period.
Negative net flow means selling exceeded buying.
However, one positive or negative day is not enough to establish a trend. The more useful question is whether the activity continues across several trading sessions.
Data Source: Investor-flow data used in PSX Insight is sourced from NCCPL (National Clearing Company of Pakistan Limited). PSX Insight organizes this data into FIPI, LIPI, sector, investor-category and historical-flow analytics to make market participation easier to analyze.
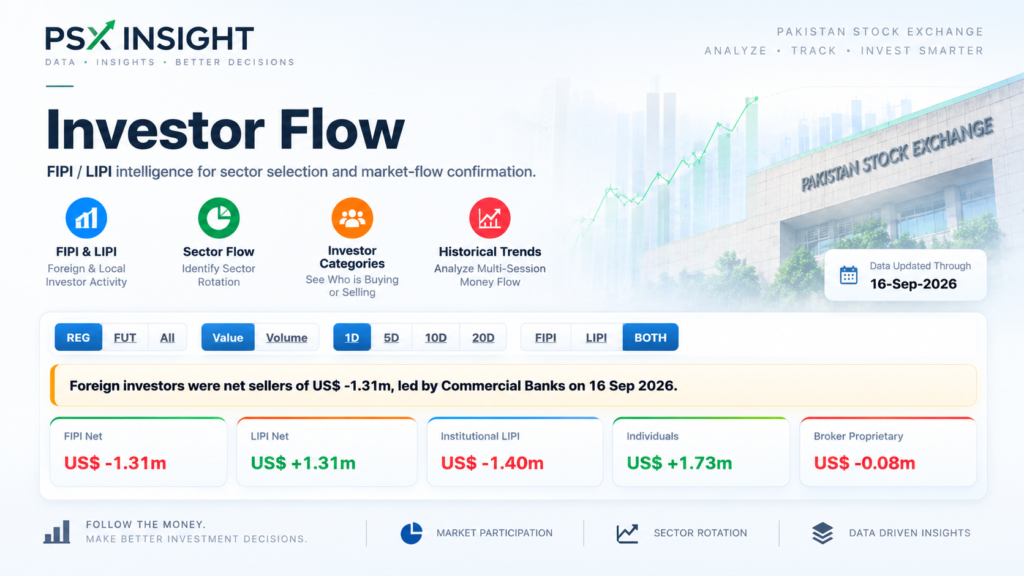
FIPI vs LIPI: Foreign and Local Investor Activity
FIPI — Foreign Investor Portfolio Investment
FIPI helps investors track foreign portfolio activity in the Pakistan Stock Exchange.
Instead of looking only at today’s foreign buying or selling, examine whether foreign participation is persistent, increasing, decreasing or reversing over several sessions.
LIPI — Local Investor Portfolio Investment
LIPI represents local investor activity.
Local investors are not one identical group. Different categories—such as companies, mutual funds, brokers/proprietary participants, individuals and other institutions—may be buying and selling for different reasons.
Therefore, PSX Insight allows investors to look beyond the headline LIPI number and examine which investor groups are creating the flow.
REG, FUT and All
The Investor Flow dashboard allows users to analyze different market views.
REG focuses on Regular Market activity, while FUT provides insight into Futures activity. All gives a broader combined view.
This distinction matters because futures activity may reflect trading, positioning or hedging and should not automatically be interpreted in the same way as regular cash-market accumulation.
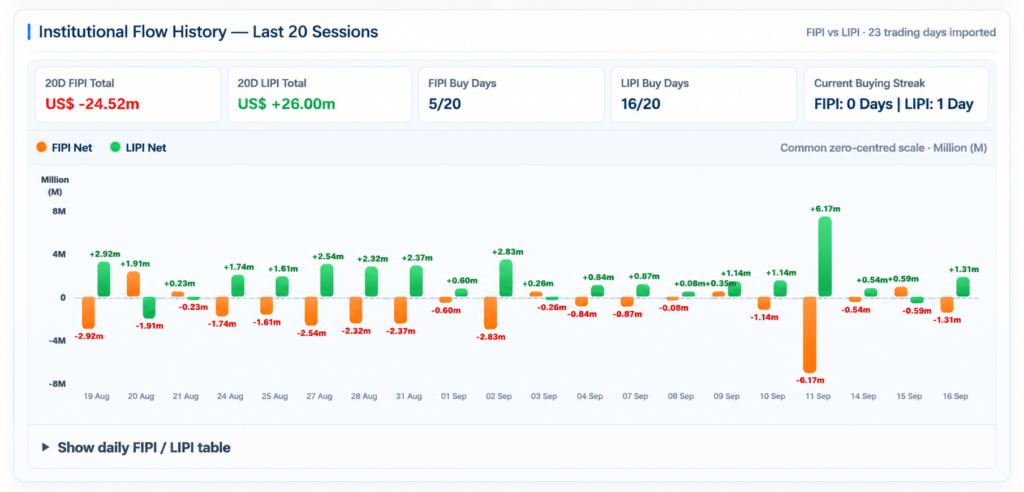
Foreign & Local Net Flow
The Foreign & Local Net Flow chart makes FIPI and LIPI activity easier to compare across recent sessions.
The zero line is the key reference:
Above zero → Net Buying
Below zero → Net Selling
Do not focus only on the largest positive or negative day. Look at the direction and persistence of the flow.
Repeated positive readings can indicate sustained buying participation, while repeated negative readings can indicate continued selling pressure.
Investor Sector Flow: Where Is the Money Going?
Once you understand the overall market flow, the next question is:
Which PSX sectors are receiving the money?
The Investor Sector Flow Analysis helps identify sectors experiencing net buying and those facing net selling.
This is useful for researching sector strength and possible sector rotation.
For example, if the market is rising but positive investor flow is concentrated in only a few sectors, participation may be relatively narrow. If several sectors show persistent positive flow, participation is broader.
Neither condition predicts what will happen next, but each provides useful market context.
Sector Investor Heatmap
The Sector Investor Heatmap provides a fast visual comparison of investor flow across sectors and different periods.
Instead of looking only at today’s number, compare:
1D → 5D → 10D → 20D
For example:
1D + | 5D + | 10D + | 20D +
shows a different flow structure from:
1D + | 5D − | 10D − | 20D −
The second case may show recent improvement, but one positive session does not confirm a lasting change.
This is why multi-period flow analysis is more informative than simply searching for today’s strongest positive number.
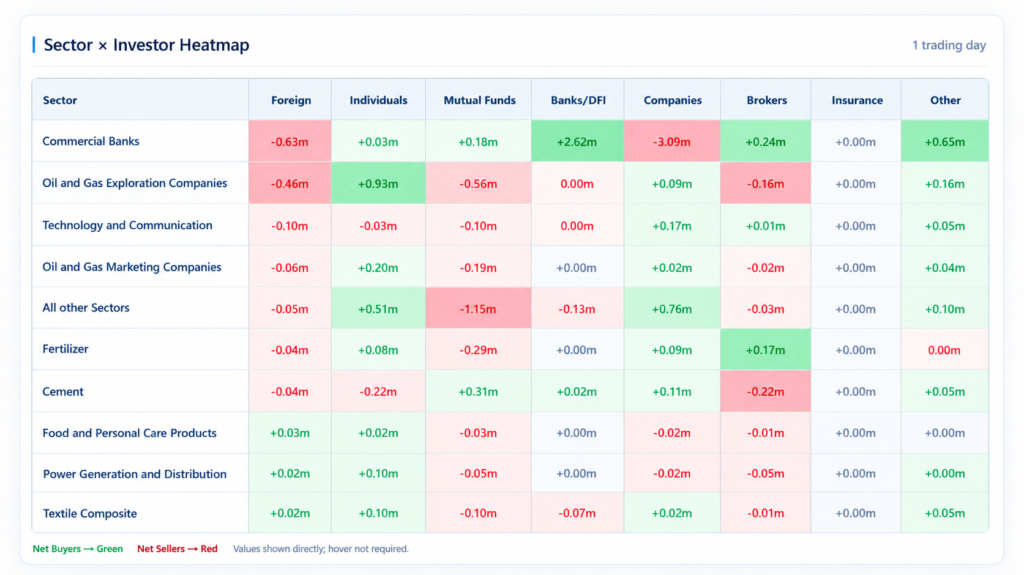
Top Accumulation & Top Distribution
The Top Accumulation section helps identify areas showing stronger net buying characteristics.
The Top Distribution section highlights areas experiencing stronger selling activity.
These should be treated as research shortlists—not automatic trading signals.
After finding accumulation or distribution, check:
Is it persistent? Who is creating the flow? Is the sector trend confirming it? What is happening to price and volume?
Historical Investor Flow — Last 20 Sessions
One day’s investor flow is a snapshot. Historical flow provides the bigger picture.
The Last 20 Sessions analysis helps investors identify whether buying or selling is:
Strengthening → Weakening → Persistent → Reversing → Volatile
A large positive day following several negative sessions means something different from steady positive participation across many sessions.
Historical context therefore helps prevent investors from overreacting to a single day’s activity.
How to Read Investor Flow Like a Professional
The most useful approach is to move from the broad market toward individual stocks.
1. Check Market Flow
Start with overall FIPI and LIPI. Determine whether foreign and local participants are currently net buyers or sellers.
2. Find Sector Flow
Move to Investor Sector Flow and compare 1D, 5D, 10D and 20D activity.
3. Identify Who Is Buying
Use investor-category analysis to understand which participants are creating the positive or negative flow.
4. Check Accumulation & Distribution
Use the heatmap and accumulation/distribution sections to create a research shortlist.
5. Move to Stocks
Identify stocks within the stronger or improving sectors that deserve further investigation.
6. Validate the Trend
Finally, compare investor flow with price trend, volume, moving averages, momentum, relative strength and other technical indicators.
A simple rule to remember:
Investor Flow tells you where participation is occurring. Technical analysis helps determine whether price is confirming it.
Price + Investor Flow: A Simple Framework
| Price | Investor Flow | Possible Interpretation |
|---|---|---|
| Rising | Sustained positive | Flow may support existing strength |
| Rising | Persistent negative | Divergence worth investigating |
| Falling | Improving positive | Possible early accumulation; confirmation needed |
| Falling | Continued negative | Price weakness and selling remain aligned |
These are analytical observations, not guaranteed buy or sell signals.
Use Investor Flow With Other PSX Insight Tools
Investor-flow analysis becomes more useful when combined with other market data.
After identifying interesting sectors or investor activity, continue your research through the Sector Dashboard to check sector strength, the UIN Market Overview and UIN Settlement tools for settlement-level analysis, and the Advanced Stock Screener for technical confirmation.
This creates a complete research sequence:
Investor Flow → Sector Strength → Stock Selection → Technical Validation
Common Investor Flow Mistakes
Avoid treating positive flow as an automatic BUY or negative flow as an automatic SELL.
Also avoid relying only on one trading session, looking only at total FIPI/LIPI without checking investor categories, ignoring sector concentration, or interpreting REG and FUT activity identically.
Most importantly, investor flow should complement—not replace—price analysis, technical analysis, fundamental research and risk management.
Frequently Asked Questions
What is investor flow in PSX?
Investor flow shows buying and selling activity among different investor groups participating in the Pakistan Stock Exchange.
What is FIPI in PSX?
FIPI stands for Foreign Investor Portfolio Investment and represents foreign portfolio investor activity.
What is LIPI in PSX?
LIPI stands for Local Investor Portfolio Investment and represents local investor activity.
What does positive net flow mean?
Positive net flow means measured buying exceeded selling for the selected investor group, sector, market and period.
What does negative investor flow mean?
Negative flow means measured selling exceeded buying. It does not automatically mean the market or stock will fall.
How can investor flow help identify sector rotation?
Comparing investor flows across sectors and multiple periods can reveal where buying participation is strengthening and where selling is increasing, helping investors investigate possible sector rotation.
Is Investor Flow a buy or sell signal?
No. Investor flow is an analytical input. Price, volume, technical structure, fundamentals and risk should also be considered.
Final Takeaway: Follow the Money, Then Validate the Trend
The PSX Insight Investor Flow dashboard turns FIPI, LIPI and investor data into a structured market-research process.
Instead of asking only “Is money coming into PSX?”, ask:
Where is the money moving? Who is buying? Which sectors are attracting it? Is the flow continuing across several sessions? And is price confirming it?
The strongest use of investor-flow analysis is therefore:
Find the Flow → Identify the Sector → Understand the Investor → Find the Stock → Validate the Trend
Use PSX Investor Flow as another layer of evidence when researching opportunities—and make your final investment decision based on a broader analysis.
Disclaimer
PSX Insight analytics and educational content are provided for research and educational purposes only. Investor-flow data and technical indicators do not guarantee future performance and should not be considered personalized investment advice or a recommendation to buy or sell any security.